Change Language :
iglidur® J2 material data - no longer available
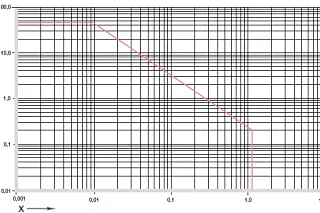
Diagram 01: Permissible pv values for iglidur® J2 plain bearings with 1mm wall thickness in dry operation against a steel shaft, at +20°C, mounted in a steel housing
X = Surface speed [m/s]
Y = Load [MPa]
With respect to its general mechanical and thermal specifications, iglidur® J2 is directly comparable to our classic, iglidur® J. Therefore, iglidur® J2 is superior to iglidur® J with respect to the mechanical specifications, e.g. maximum recommended surface pressure. However, compromises must be made regarding wear resistance in dry operation.
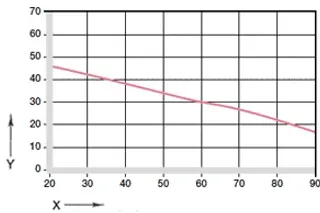
Diagram 02: Maximum recommended surface pressure as a function of temperature (46MPa at +20°C)
X = Temperature [°C]
Y = Load [MPa]
Mechanical specifications
With increasing temperatures, the compressive strength of iglidur® J2 plain bearings decreases. Diagram 02 shows this relationship. The maximum recommended surface pressure represents a mechanical material property. No conclusions regarding the tribological properties can be drawn from this.
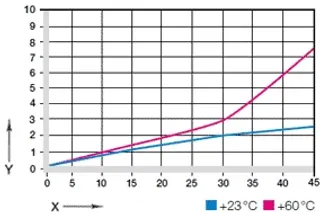
Diagram 03: Deformation under pressure and temperature
X = Load [MPa]
Y = Deformation [%]
Diagram 03 shows the elastic deformation of iglidur® J2 at radial loads. A possible deformation could be, among others, dependant on the duty cycle of the load.


Shaft materials
The friction and wear are also dependent, to a large degree, on the mating partner. Shafts that are too smooth increase both the coefficient of friction and the wear of the bearing. Diagram 06 shows results of tests with different shaft materials. Diagram 06 shows that iglidur® J2 delivers good coefficient of wear especially with free cutting steel in rotation at 1MPa. In dry operation, the coefficient of wear is sometimes significantly higher on other shafts.
Unlike many other iglidur® materials, the wear rate in pivoting is slightly higher compared to the rate in rotation with otherwise identical parameters (diagram 07).


Consulting
I look forward to answering your questions
Hennlich OOD | Хенлих ООД+359 32 621929Write e-mail
Shipping and consultation
In person:
Monday to Friday from 7 am - 8 pm.
Saturdays from 8 am- 12 pm.
Online:
24h
WhatsApp-Service:
Montag – Freitag: 8 – 16 Uhr