Change Language :
iglidur® N54 - Material data
Material data table
General properties
Unit
iglidur® N54
Testing method
Density
g/cm³
1.13
Colour
green
Max. moisture absorption at +23°C/50% room humidity
% weight
1.6
DIN 53495
Max. moisture absorption
% weight
3.6
Coefficient of sliding friction, dynamic against steel
μ
0.15-0.23
pv value, max. (dry)
MPa x m/s
0.5
Mechanical properties
Flexural modulus
MPa
1,800
DIN 53457
Flexural strength at 20°C
MPa
70
DIN 53452
Compressive strength
MPa
30
Maximum recommended surface pressure (20°C)
MPa
36
Shore D hardness
74
DIN 53505
Physical and thermal properties
Max. long-term application temperature
°C
+80
Max. short-term application temperature
°C
+120
highest short term ambient temperature1):
°C
+140
Min. application temperature
°C
-40
Thermal conductivity
W/m x K
0.24
ASTM C 177
Coefficient of thermal expansion (at 23°C)
K-1 x 10⁻⁵
9
DIN 53752
Electrical properties
Specific transitional resistance
Ωcm
< 1013
DIN IEC 93
Surface resistance
Ω
< 1011
DIN 53482
- Without additional load; no gliding movement; relaxation not excluded
Table 01: Material data
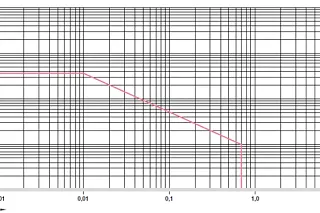
Diagram 01: Permissible pv values for iglidur® N54 plain bearing with a wall thickness of 1mm in dry operation against a steel shaft at +20°C when installed in a steel housing
X = Surface speed [m/s]
Y = Load [MPa]
iglidur® N54 is the first iglidur® material based largely on biopolymers. In addition to the fact that all iglidur® materials are lubrication-free , this is a further step towards a positive environmental balance. The low coefficient of friction in conjunction with long service life ensure that this material has a permanent place in the iglidur® product range.
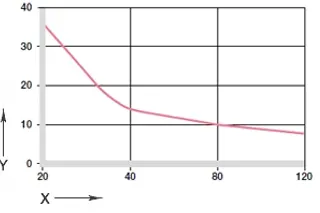
Diagram. 02: Maximum recommended surface pressure as a function of temperature (36MPa at +20°C)
X = Temperature [°C]
Y = Load [MPa]
Mechanical specifications
The maximum recommended surface pressure is a mechanical material parameter. No conclusions regarding the tribological properties can be drawn from this. With increasing temperatures, the compressive strength of iglidur® N54 plain bearings decreases. Diagram 02 shows this inverse relationship. With the long-term permitted application temperature of +120°C, the permitted surface pressure still amounts to 10MPa.
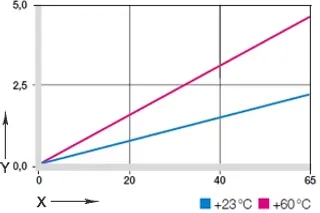
Diagram 03: Deformation under pressure and temperature
X = Load [MPa]
Y = Deformation [%]
Diagram 03 shows the elastic deformation of iglidur® N54 at radial loads.
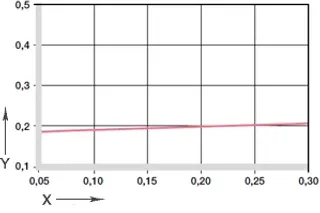
Diagram 04: Coefficient of friction as a function of the surface speed, p = 1MPa
X = Surface speed [m/s]
Y = Coefficient of friction μ
Friction and wear
The coefficient of friction of iglidur® N54 is low. Please note that a mating surface with a rough surface finish will increase the friction. We recommend shaft surfaces (Ra) of 0.1 up to a maximum of 0.4µm.
The coefficient of friction of iglidur® N54 plain bearings is only marginally dependent on the surface speed.
The influence of the load is greater; an increase in load lowers the coefficient of friction to as low as 0.8.
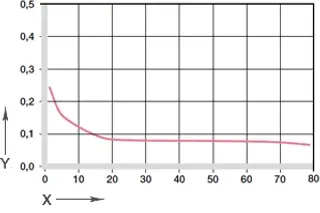
Diagram 05: Coefficient of friction as a function of the pressure, v = 0.01m/s
X = Load [MPa]
Y = Coefficient of friction µ
iglidur® N54
dry
Greases
Oil
Water
Coefficient of friction µ
0.15-0.23
0.09
0.04
0.04
Table 04: Coefficient of friction for iglidur® N54 against steel
(Ra = 1µm, 50HRC)
Shaft materials
It is important to select a suitable shaft material. As a rule, iglidur® N54 is suitable for use with hard or soft shafts, but "hard" shaft surfaces tend to give better service life. Starting at loads of 1MPa, wear increases measurably and continuously.


Consulting
I look forward to answering your questions
Hennlich OOD | Хенлих ООД+359 32 621929Write e-mail
Shipping and consultation
In person:
Monday to Friday from 7 am - 8 pm.
Saturdays from 8 am- 12 pm.
Online:
24h
WhatsApp-Service:
Montag – Freitag: 8 – 16 Uhr